Schema Diagram
Visual representation of your database
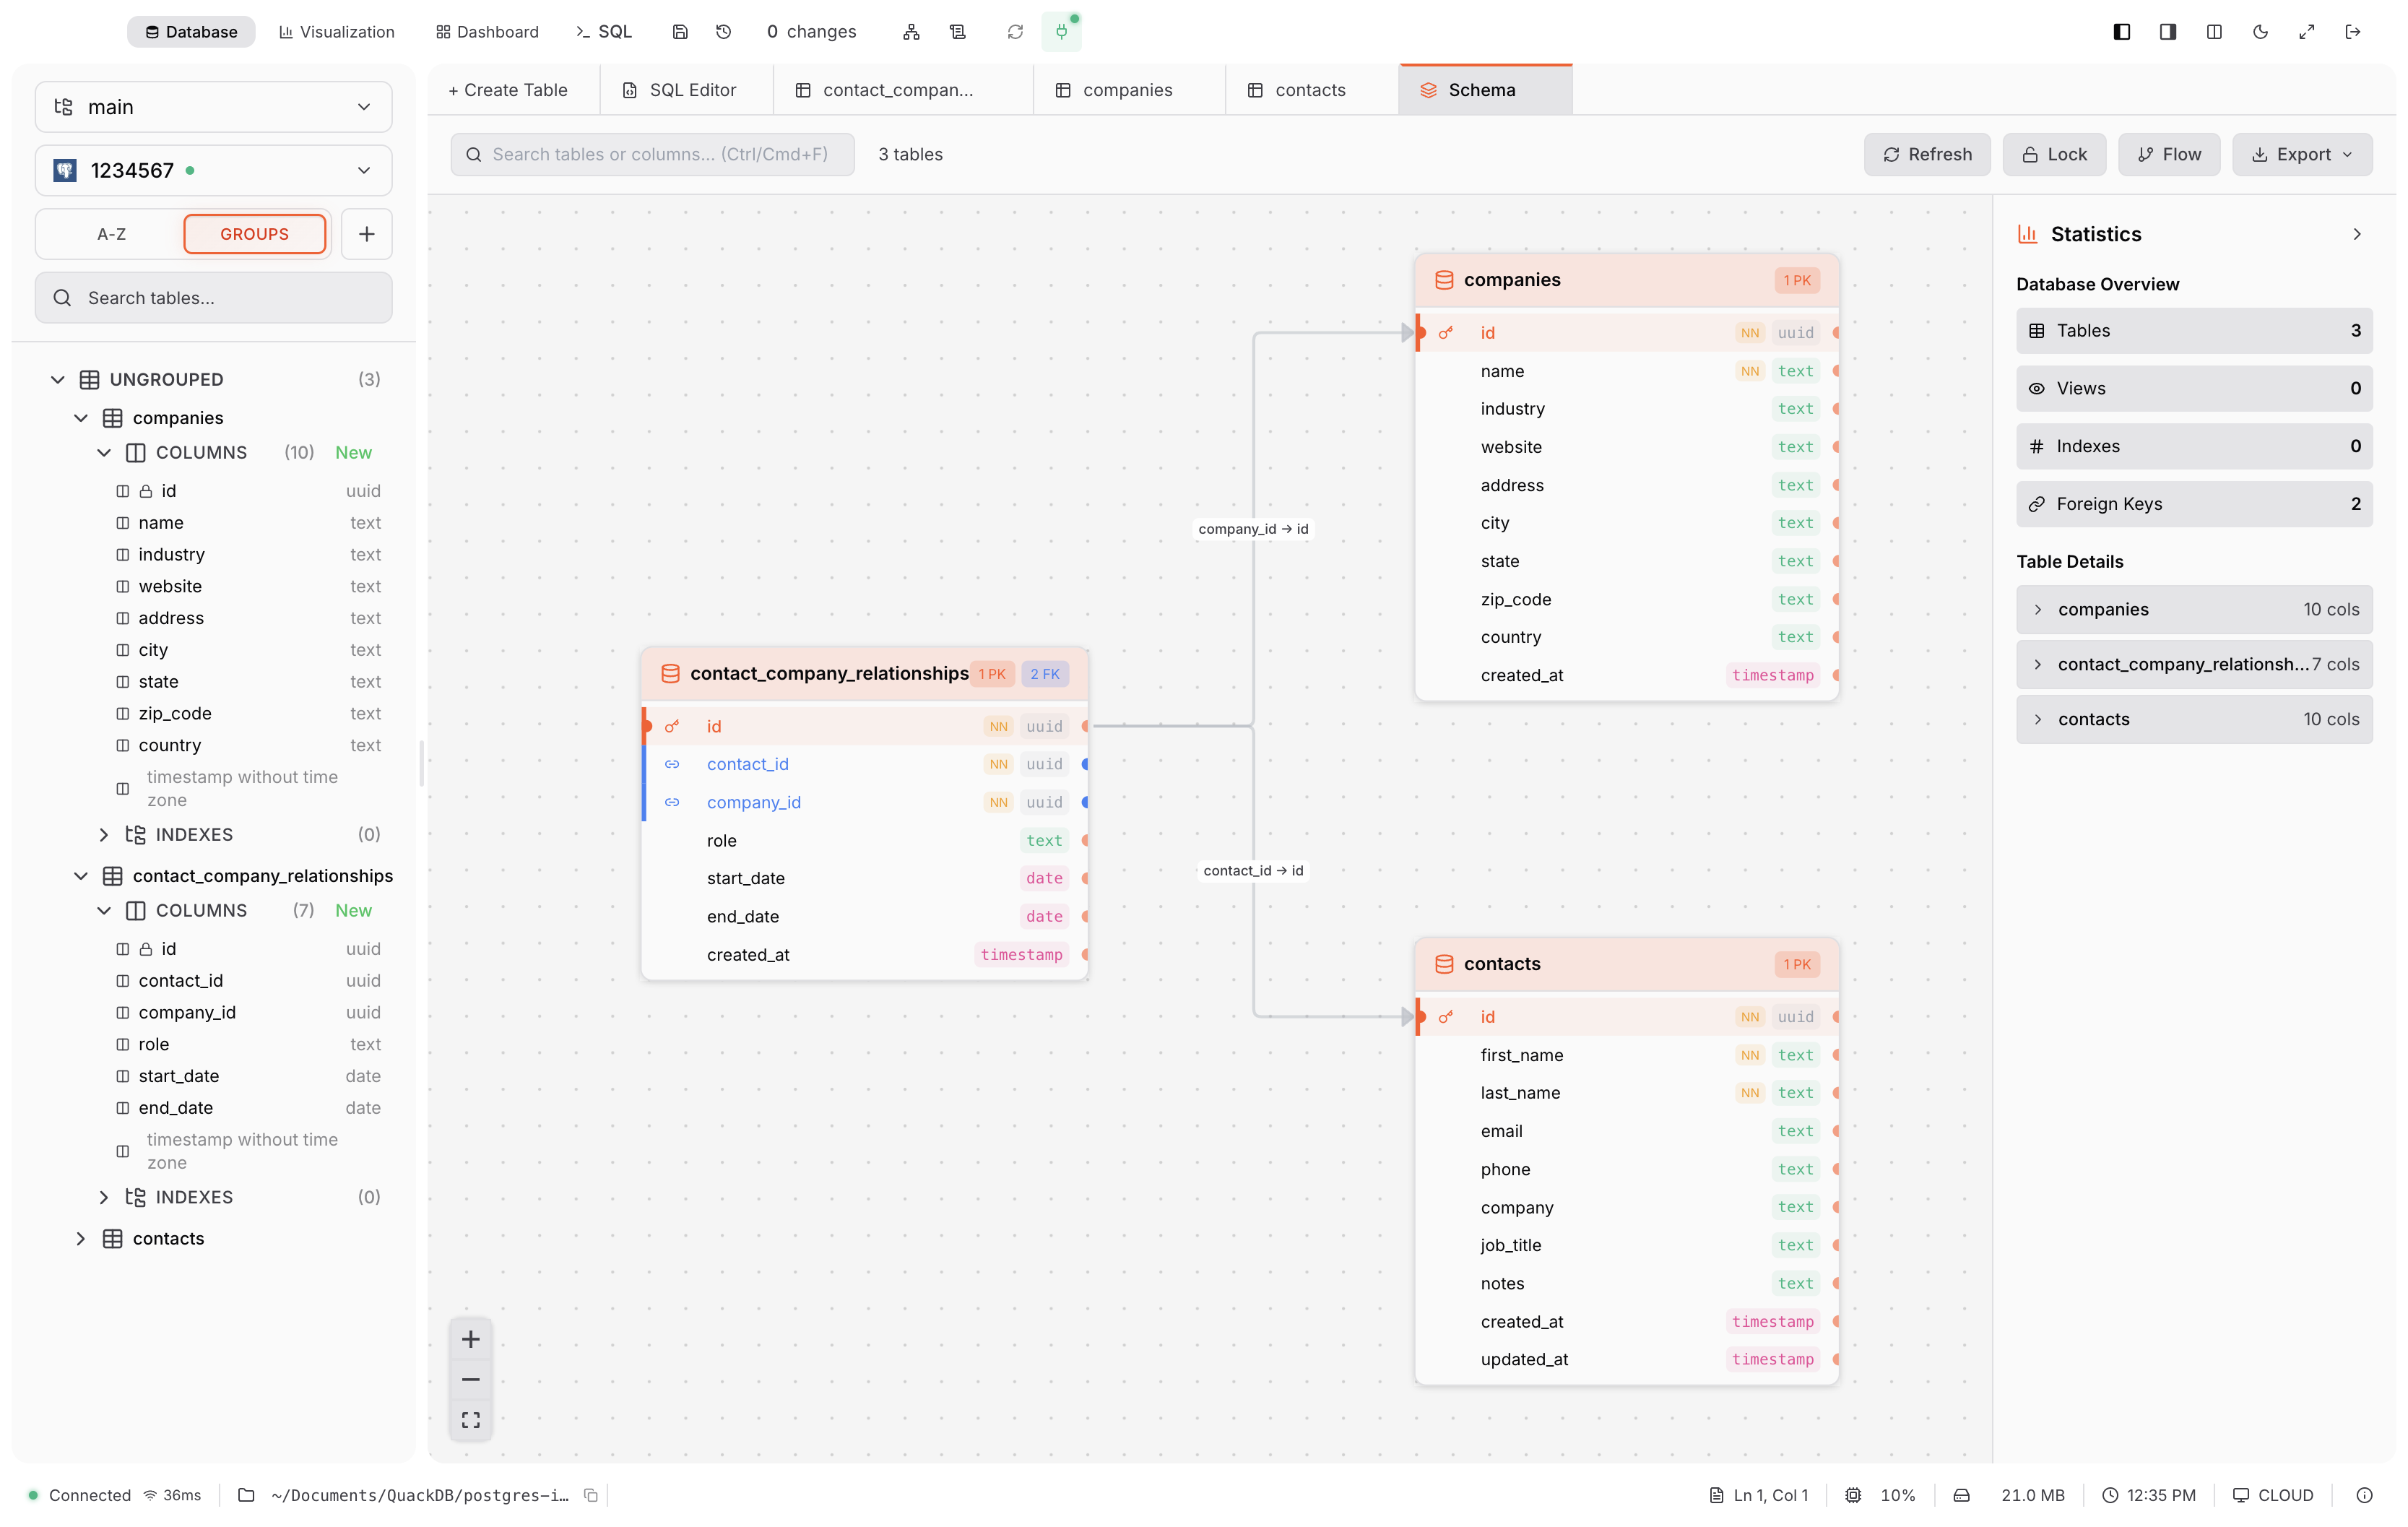
The Schema Diagram provides an interactive visualization of your database structure, powered by ReactFlow.
Features
Automatic Layout: Tables arranged using Dagre algorithm
Foreign Key Visualization: Lines connect related columns
Interactive: Drag tables, zoom with scroll, pan background
Search: Filter tables by name
Export: Save as PNG, SVG, or PDF
Position Memory: Saves your custom table positions
Visual Elements
| Element | Meaning |
|---|---|
| 🔑 Key icon | Primary key column |
| → Arrow line | Foreign key relationship |
Data Type Colors
| Type | Color |
|---|---|
| INTEGER / INT | Blue |
| TEXT / VARCHAR | Green |
| REAL / FLOAT | Orange |
| BLOB | Purple |
| DATE / TIME | Teal |
| BOOLEAN | Pink |
Tip: Click a table to highlight it and see its connections. The diagram has been tested with 50+ tables.